




 RESOURCE LIBRARY
Practical writing on moving from dashboards to decisions — how grounded AI works, what to ask your data, and where analytics is headed.
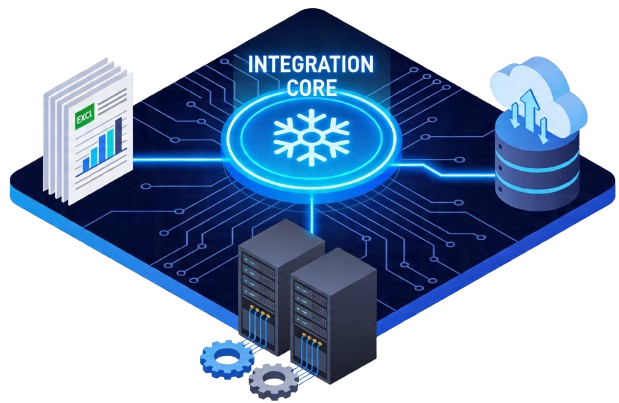
Why "what next" is the missing layer. A plain look at where dashboards stop, and how a decision-intelligence layer above your existing systems picks up.
Read the piece Decision intelligence 101
What it is, and why "what next" is the layer BI never had. A plain introduction to moving from dashboards to decisions.
Read → Decision intelligence 101
The first handful of questions worth asking across your systems — and how to read the answers you get back.
Read → Product guide
How making the query visible addresses the hallucination problem — and why it matters when you act on the result.
Read → Product guide
A walkthrough of linking your systems, framing a good question, and reading the query behind the answer.
Read →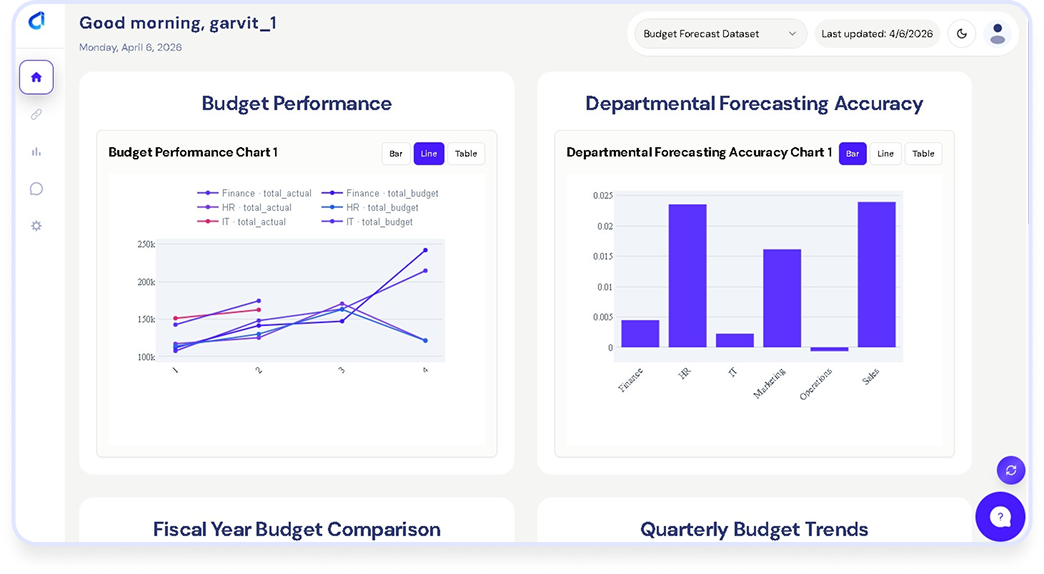 Industry playbook
A walkthrough of turning fragmented, sector-specific data into a decision — from first question to next step.
Read →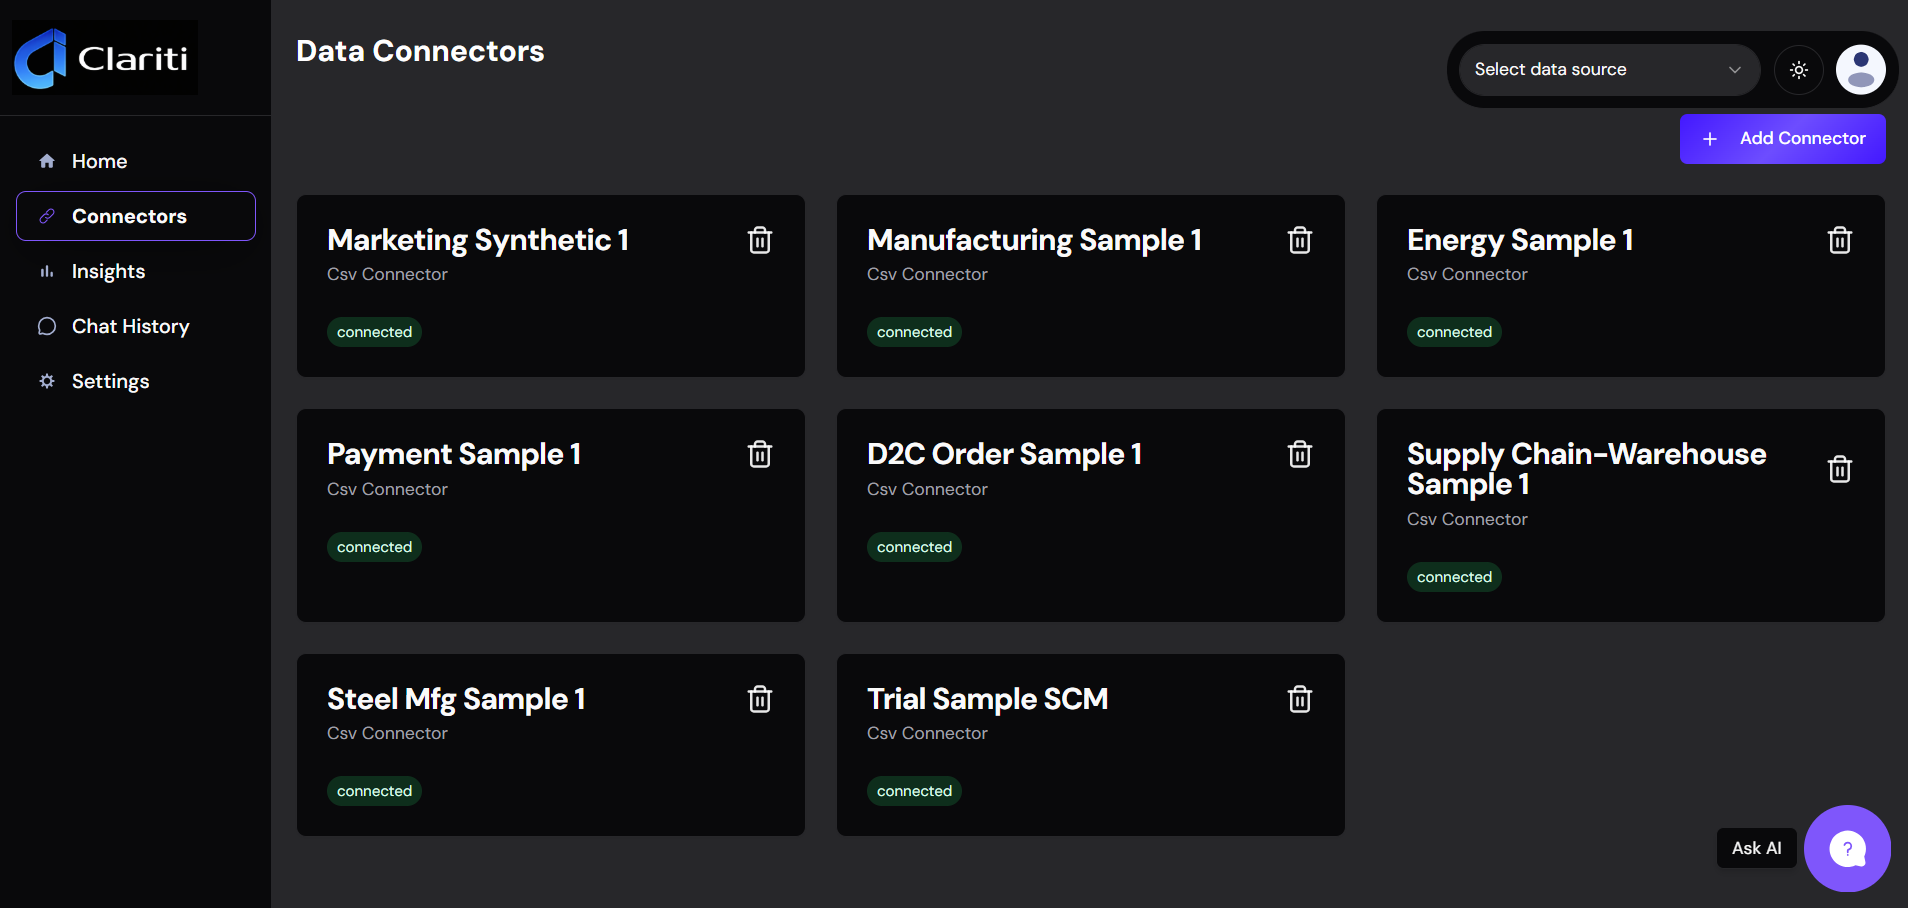 Security & data
How Clariti connects to your systems, what it does and doesn't move, and how your security team can review the data flow — plainly.
Read →Perspectives from the Clariti team on decision intelligence, grounded AI, and where analytics is headed.
Browse articles →

Step-by-step help on connecting your sources, asking better questions, and reading the query behind an answer.
Book a demo and watch Clariti answer a real question against your own systems.
Book a Demo →.png)
Sector-specific ways to turn fragmented data into decisions — practical patterns you can adapt to your business.
Read playbooks →How Clariti handles your data — read-only by default, what moves and what doesn't, and how your security team can review it.
Read more



Evaluating your options? These comparisons explain how a decision-intelligence layer that sits above your systems differs from traditional BI tools and data-science platforms.




How a decision-intelligence layer you ask in plain English differs from a data-science platform built for model building.
Read comparison →Where dashboards stop and "what next" begins — how Clariti complements a BI tool rather than replacing it.
Read comparison →Visual analytics versus asking a question in plain English and getting the reasoning shown — how the two fit together.
Read comparison →An analytics workbench for data teams versus a decision layer any team can ask directly — where each one fits.
Read comparison →RESTful endpoints, authentication, and error codes.
Get up and running with Python, JS, and Ruby in minutes.
How Clariti connects read-only, what data moves, and how deployment and access work.
How to handle real-time notifications and system hooks.
Attribution Modeling: The process of identifying a set of user actions across multiple touchpoints that contribute to a desired outcome.
Churn Rate: The percentage of subscribers who discontinue their service subscriptions within a given time period.
Data Normalization: The organization of data to appear similar across all records and fields, minimizing redundancy and dependency.
Feature Engineering: The process of using domain knowledge to extract features (characteristics, properties, attributes) from raw data.
Latency: The delay before a transfer of data begins following an instruction for its transfer, critical in real-time analytics.
See Clariti on your own data in 15 minutes.
Ask a question, get a
grounded answer, and the next step to take.